Feature Selection on the WHO Dataset
[1]:
import pandas as pd
from matplotlib import pyplot as plt
import numpy as np
from tqdm.auto import tqdm
from sklearn.kernel_ridge import KernelRidge
from sklearn.model_selection import train_test_split
from skmatter.preprocessing import StandardFlexibleScaler
from skmatter.feature_selection import PCovFPS, PCovCUR, FPS, CUR
from skmatter.datasets import load_who_dataset
/home/docs/checkouts/readthedocs.org/user_builds/scikit-matter/envs/v0.1.4/lib/python3.8/site-packages/tqdm/auto.py:21: TqdmWarning: IProgress not found. Please update jupyter and ipywidgets. See https://ipywidgets.readthedocs.io/en/stable/user_install.html
  from .autonotebook import tqdm as notebook_tqdm
Load the Dataset
[2]:
df = load_who_dataset()['data']
df
[2]:
| Country | Year | SP.POP.TOTL | SH.TBS.INCD | SH.IMM.MEAS | SE.XPD.TOTL.GD.ZS | SH.DYN.AIDS.ZS | SP.DYN.LE00.IN | SH.IMM.IDPT | SH.XPD.CHEX.GD.ZS | SN.ITK.DEFC.ZS | NY.GDP.PCAP.CD | |
|---|---|---|---|---|---|---|---|---|---|---|---|---|
| 0 | Afghanistan | 2005 | 24411191.0 | 189.0 | 50.0 | 2.57000 | 0.1 | 58.361 | 58.0 | 9.948290 | 36.1 | 255.055120 |
| 1 | Afghanistan | 2006 | 25442944.0 | 189.0 | 53.0 | 2.90000 | 0.1 | 58.684 | 58.0 | 10.622766 | 33.3 | 274.000486 |
| 2 | Afghanistan | 2007 | 25903301.0 | 189.0 | 55.0 | 2.85000 | 0.1 | 59.111 | 63.0 | 9.904675 | 29.8 | 375.078128 |
| 3 | Afghanistan | 2008 | 26427199.0 | 189.0 | 59.0 | 3.51000 | 0.1 | 59.852 | 64.0 | 10.256495 | 26.5 | 387.849174 |
| 4 | Afghanistan | 2009 | 27385307.0 | 189.0 | 60.0 | 3.73000 | 0.1 | 60.364 | 63.0 | 9.818487 | 23.3 | 443.845151 |
| ... | ... | ... | ... | ... | ... | ... | ... | ... | ... | ... | ... | ... |
| 2015 | South Africa | 2015 | 55876504.0 | 988.0 | 86.0 | 5.48285 | 18.2 | 63.950 | 85.0 | 8.790190 | 5.2 | 6204.929901 |
| 2016 | South Africa | 2016 | 56422274.0 | 805.0 | 84.0 | 5.44424 | 18.4 | 64.747 | 85.0 | 8.821429 | 5.4 | 5735.066787 |
| 2017 | South Africa | 2017 | 56641209.0 | 738.0 | 81.0 | 5.59867 | 18.5 | 65.402 | 84.0 | 8.722624 | 5.5 | 6734.475153 |
| 2018 | South Africa | 2018 | 57339635.0 | 677.0 | 81.0 | 5.64401 | 18.6 | 65.674 | 82.0 | 8.858297 | 5.7 | 7048.522211 |
| 2019 | South Africa | 2019 | 58087055.0 | 615.0 | 83.0 | 5.91771 | 18.6 | 66.175 | 85.0 | 9.109355 | 6.3 | 6688.787271 |
2020 rows × 12 columns
[3]:
columns = np.array([
    "SP.POP.TOTL",
    "SH.TBS.INCD",
    "SH.IMM.MEAS",
    "SE.XPD.TOTL.GD.ZS",
    "SH.DYN.AIDS.ZS",
    "SH.IMM.IDPT",
    "SH.XPD.CHEX.GD.ZS",
    "SN.ITK.DEFC.ZS",
    "NY.GDP.PCAP.CD",
])

column_names = np.array([
    "Population",
    "Tuberculosis",
    "Immunization, measles",
    "Educ. Expenditure",
    "HIV",
    "Immunization, DPT",
    "Health Expenditure",
    "Undernourishment",
    "GDP per capita",
])

columns = columns[[8, 4, 5, 6, 1, 0, 7, 3, 2]].tolist()
column_names = column_names[[8, 4, 5, 6, 1, 0, 7, 3, 2]].tolist()
[4]:
X_raw = np.array(df[columns])

# We are taking the logarithm of the population and GDP to avoid extreme distributions
log_scaled = ['SP.POP.TOTL', 'NY.GDP.PCAP.CD']
for ls in log_scaled:
    print(X_raw[:, columns.index(ls)].min(), X_raw[:, columns.index(ls)].max())
    if ls in columns:
        X_raw[:, columns.index(ls)] = np.log10(
            X_raw[:, columns.index(ls)]
        )
y_raw = np.array(df["SP.DYN.LE00.IN"])  # [np.where(df['Year']==2000)[0]])
y_raw = y_raw.reshape(-1, 1)
X_raw.shape
149841.0 7742681934.0
110.460874721483 123678.70214327476
[4]:
(2020, 9)
Scale and Center the Features and Targets
[5]:
x_scaler = StandardFlexibleScaler(column_wise=True)
X = x_scaler.fit_transform(X_raw)

y_scaler = StandardFlexibleScaler(column_wise=True)
y = y_scaler.fit_transform(y_raw)

n_components = 2

X_train, X_test, y_train, y_test = train_test_split(X, y, test_size=0.3, shuffle=True, random_state=0)
Provide an estimated target for the feature selector
[6]:
kernel_params = {"kernel": "rbf", "gamma": 0.08858667904100832}
krr = KernelRidge(alpha=0.006158482110660267, **kernel_params)

yp_train = krr.fit(X_train, y_train).predict(X_train)
Compute the Selections for Each Selector Type
[7]:
n_select = X.shape[1]
PCov-CUR
[8]:
pcur = PCovCUR(n_to_select=n_select, progress_bar=True, mixing=0.0)
pcur.fit(X_train, yp_train)
100%|██████████| 9/9 [00:00<00:00, 126.26it/s]
[8]:
PCovCUR(mixing=0.0, n_to_select=9, progress_bar=True)In a Jupyter environment, please rerun this cell to show the HTML representation or trust the notebook.
On GitHub, the HTML representation is unable to render, please try loading this page with nbviewer.org.
PCovCUR(mixing=0.0, n_to_select=9, progress_bar=True)
PCov-FPS
[9]:
pfps = PCovFPS(n_to_select=n_select, progress_bar=True, mixing=0.0, initialize=pcur.selected_idx_[0])
pfps.fit(X_train, yp_train)
100%|██████████| 8/8 [00:00<00:00, 6192.00it/s]
[9]:
PCovFPS(mixing=0.0, n_to_select=9, progress_bar=True)In a Jupyter environment, please rerun this cell to show the HTML representation or trust the notebook.
On GitHub, the HTML representation is unable to render, please try loading this page with nbviewer.org.
PCovFPS(mixing=0.0, n_to_select=9, progress_bar=True)
CUR
[10]:
cur = CUR(n_to_select=n_select, progress_bar=True)
cur.fit(X_train, y_train)
100%|██████████| 9/9 [00:00<00:00, 335.71it/s]
[10]:
CUR(n_to_select=9, progress_bar=True)In a Jupyter environment, please rerun this cell to show the HTML representation or trust the notebook.
On GitHub, the HTML representation is unable to render, please try loading this page with nbviewer.org.
CUR(n_to_select=9, progress_bar=True)
FPS
[11]:
fps = FPS(n_to_select=n_select, progress_bar=True, initialize=cur.selected_idx_[0])
fps.fit(X_train, y_train)
100%|██████████| 8/8 [00:00<00:00, 4743.35it/s]
[11]:
FPS(initialize=8, n_to_select=9, progress_bar=True)In a Jupyter environment, please rerun this cell to show the HTML representation or trust the notebook.
On GitHub, the HTML representation is unable to render, please try loading this page with nbviewer.org.
FPS(initialize=8, n_to_select=9, progress_bar=True)
(For Comparison) Recurisive Feature Addition
[12]:
class RecursiveFeatureAddition:
    def __init__(self, n_to_select):
        self.n_to_select = n_to_select
        self.selected_idx_ = np.zeros(n_to_select, dtype=int)
    def fit(self, X, y):
        remaining = np.arange(X.shape[1])
        for n in range(self.n_to_select):
            errors = np.zeros(len(remaining))
            for i, pp in enumerate(remaining):
                krr.fit(
                    X[:, [*self.selected_idx_[:n], pp]], y
                )
                errors[i] = krr.score(X[:, [*self.selected_idx_[:n], pp]], y)
            self.selected_idx_[n] = remaining[np.argmax(errors)]
            remaining = np.array(np.delete(remaining, np.argmax(errors)), dtype=int)
        return self
rfa = RecursiveFeatureAddition(n_select).fit(X_train, y_train)
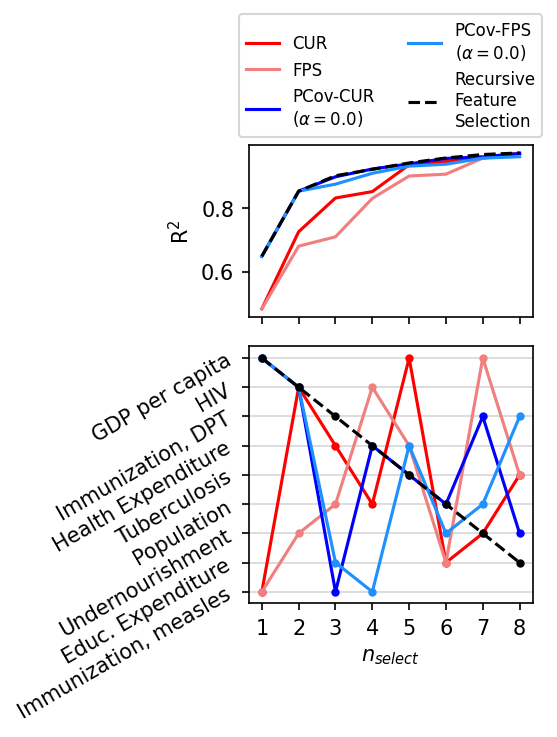
Plot our Results
[13]:
fig, axes = plt.subplots(2, 1,figsize=(3.75, 5), gridspec_kw=dict(height_ratios=(1,1.5)), sharex=True, dpi=150)
ns = np.arange(1, n_select, dtype=int)

all_errors = {}
for selector, color, linestyle, label in zip(
    [cur, fps, pcur, pfps, rfa],
    ["red", "lightcoral",  "blue", "dodgerblue", "black"],
    ["solid", "solid", "solid", "solid", "dashed"],
    [
        "CUR",
        "FPS",
        "PCov-CUR\n"+r"($\alpha=0.0$)",
        "PCov-FPS\n"+r"($\alpha=0.0$)",
        "Recursive\nFeature\nSelection",
    ],
):
    if label not in all_errors:
        errors = np.zeros(len(ns))
        for i, n in enumerate(ns):
            krr.fit(X_train[:, selector.selected_idx_[:n]], y_train)
            errors[i] = krr.score(X_test[:, selector.selected_idx_[:n]], y_test)
        all_errors[label] = errors
    axes[0].plot(ns, all_errors[label], c=color, label=label, linestyle=linestyle)
    axes[1].plot(ns, selector.selected_idx_[:max(ns)], c=color, marker='.', linestyle=linestyle)

axes[1].set_xlabel(r"$n_{select}$")
axes[1].set_xticks(range(1, n_select))
axes[0].set_ylabel(r"R$^2$")
axes[1].set_yticks(np.arange(X.shape[1]))
axes[1].set_yticklabels(column_names, rotation=30, fontsize=10)
axes[0].legend(ncol=2, fontsize=8, bbox_to_anchor=(0.5, 1.0), loc='lower center')
axes[1].invert_yaxis()
axes[1].grid(axis='y', alpha=0.5)
plt.tight_layout()
plt.show()